Call Inspector
The Agora Analytics Call Inspector enables you to:
- Find a call or a group of calls.
- Determine the overall call quality in a channel.
- Dive into user-specific metrics and events.
- Examine user experience issues.
The following workflow shows how to use Call Inspector features:

To enable Call Inspector, subscribe to an Agora Analytics pricing plan. For details, see Pricing.
Use Call Search
On the Call Search page, you can apply multiple filters such as channel name, call duration, call freeze rates, and number of users to search calls and view their basic information.
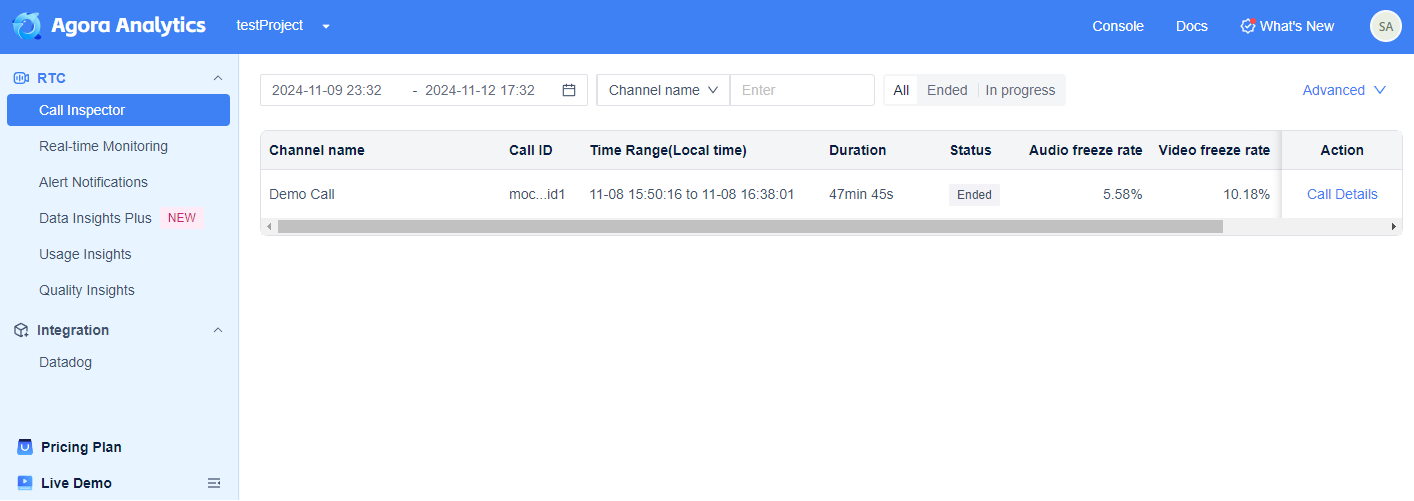
To search calls, follow these steps:
-
Log in to Agora Console and click Agora Analytics > Call Inspector in the left navigation menu.
-
In the upper-left corner, select a project. You see all the available calls under the project.
-
Start a search in one of the following ways:
-
Basic search: On the top of the page, select a time range, channel name or call ID, and call status.
-
Advanced search: Click Advanced in the upper right corner, add one or more filters as needed, and then click Search.
-
The accessible time range depends on the data retention policy for Call Inspector features in your Pricing Plan.
Get Call Overview
The Call Overview page is designed to help you quickly understand the overall situation of a large-scale call, so that you can locate problems or users and inspect user-specific issues. This page includes a summary of exceptions, as well as comprehensive metric statistics.
To enter the Call Overview page, follow these steps:
- Subscribe to the Premium or Enterprise pricing plan. Other pricing plans do not provide access to the Call Overview page.
- Use Call Search to find the call you want to inspect, then click Call Details in the Action column.
- If the number of Accumulated Call Users (ACU) is greater than or equal to 50, you enter the Call Overview page.
- If the number of ACU is less than 50, you first enter the Call Details page. Click the Call Overview tab on the top to switch.
The Call Overview page consists of the following sections.
Exception summary
This section shows issues that might significantly affect user experience in the current call, including the following subsections:
| Description | Notes | |
|---|---|---|
| Statistical insights | Important conclusions related to audio and video freezing. |
|
Detailed statistics
This section displays call quality statistics through various charts to help monitor and analyze large-scale calls.
This section includes the following subsections:
| Sub-section | Description | Notes |
|---|---|---|
| Time selector | Select the time range you want to inspect. | If you change the time range, the data displayed in all of the following subsections is updated. |
| Top video freezing users/Video freeze details |
| N/A |
| TOP audio freezing users/Audio freeze details |
| N/A |
| Trend tracking | Relations between the following metrics and time:
|
|
| Metric Analysis | Distribution of audio freeze rate and video freeze rate by geography, device, network, SDK version, and operating system. | If the number of ACU in the current call does not exceed 20, this subsection is hidden. |
View Call Details
The Call Details page helps you locate user-specific quality issues and exceptions. It consists of the following subpages:
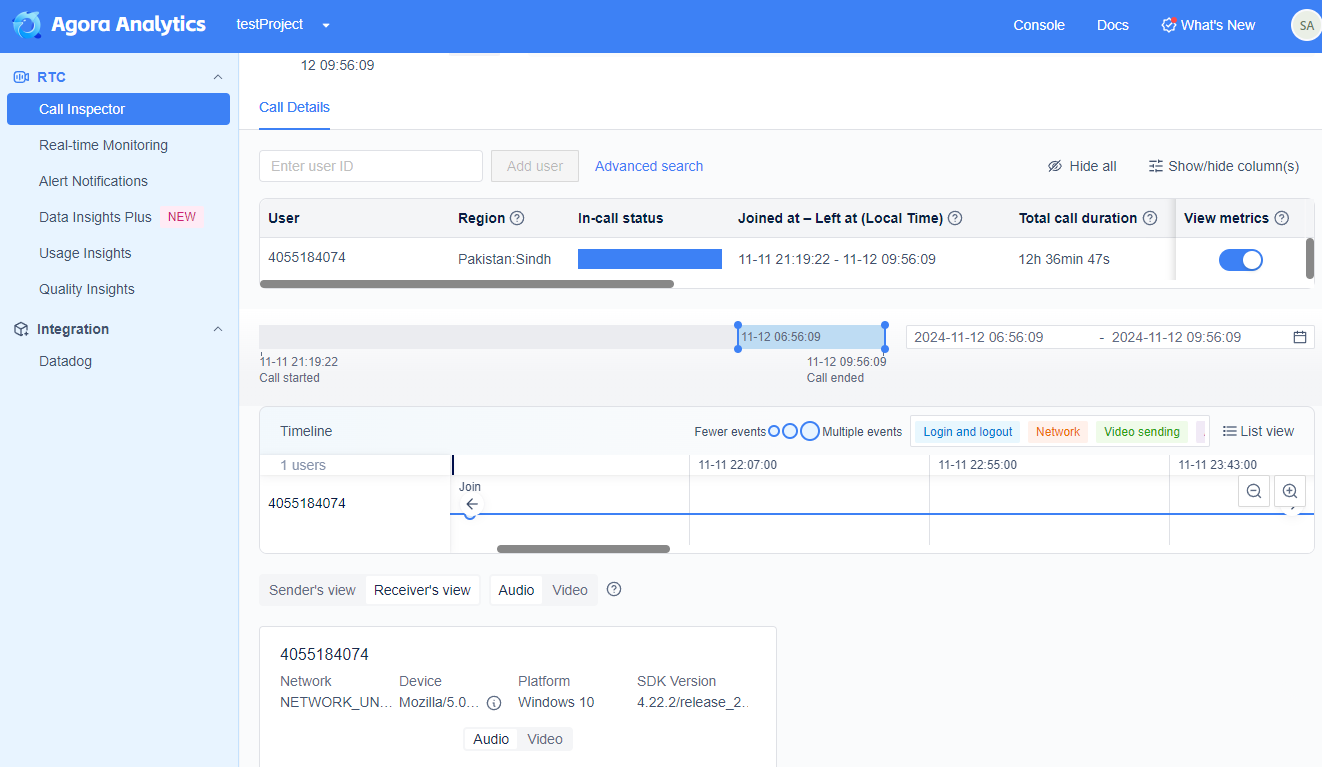
- Homepage: The page you enter by clicking the Call Details tab on the top. On the homepage, you can get basic information about each user in the call. You can also view the key events and audio and video quality metrics for 20 users simultaneously.
- End-to-end details page: This page provides all the key quality metrics and events for a single sender-receiver pair.
- Sender details page: This page provides all of the key quality metrics and events for a single sender.
For details on how to troubleshoot common call-quality issues, see Troubleshooting.
Homepage
To view the Call Details homepage, follow these steps:
-
Use Call Search to find the call, then click Call Details in the Action column.
-
If the ACU is greater than or equal to 50, first enter the Call Overview page. Click the Call Details tab on the top to switch.
-
If the ACU is less than 50, you enter the Call Details homepage.
-
-
Add users through one of the following ways:
-
Add one by one: Enter the user ID, and click Add User.
-
Add in a batch: Click Advanced search, add one or more filters as needed, and then click Search. In the returned list, select the users you want to add, and click Save.
-
-
Display or hide the audio and video quality metrics for the added users: Click the switch in the View metrics column. You can turn on the switch for a maximum of 20 users simultaneously.
-
Select the time range you want to inspect. If the time range changes, the audio and video quality metrics data is updated.
Key events
For each user with the View metrics switch enabled, this section displays their events within the selected time range in two views: Timeline and List
Timeline view
The circles on the timeline represent events. A larger circle means more events occurred at that time. If a noteworthy event occurred, the circle is marked red.
In the timeline view, you can do the following:
-
Hover your mouse over a circle to view event logs.
-
Click the zoom-in or zoom-out icon in the upper right corner to adjust the time scale.
-
Select one or more event types using the drop-down menu in the upper right corner, including login and logout, network transmission, video sending, and audio sending.
-
Click List view in the upper right corner to switch to the list view.
List view
The list view has three columns: Time, event type, and event. The list is displayed side by side with the corresponding user’s audio and video quality metrics.
In the list view, you can do the following:
-
Select one or more event types using the drop-down menu in the upper right corner, including login and logout, network transmission, video sending, video receiving, audio sending, and audio receiving.
-
Click Timeline view in the upper right corner to switch to the timeline view.
Audio and video quality metrics
With the core audio and video metrics displayed in the sender’s and receiver’s view, this section shows the quality of experience within the selected time range for each user whose View metrics switch is turned on (referred to as "selected users").
The metrics are defined in User-specific metrics.
Sender’s view
Click Sender’s view, and choose Audio or Video. You can see the sending bitrates and upstream packet loss rates for all senders among the selected users.
Follow these steps to locate abnormal senders:
-
If the line chart has many red glitches, the upstream packet loss rate might be high. Click View sender details in the upper right corner to enter the sender details page for further inspection.
-
If an exclamation mark appears in the upper right corner, the user might encounter an issue that significantly affects the user experience. Click the exclamation mark to enter this user’s Call diagnosis (Beta) page.
Receiver’s view
Click Receiver’s view, and click Audio or Video. You can see the receiving bitrates and freeze time for all receivers among the selected users. If audio and video streams from multiple senders are received, they are marked in different colors on the line chart.
Follow these steps to locate abnormal receivers:
-
If the line chart has many red glitches, the receiver might experience significant freezing issues. In the upper right corner of the line chart, click Inspect a remote client, and select the corresponding sender’s user ID from the drop-down menu. You enter the end-to-end details page for further inspection.
-
If an exclamation mark
 appears in the upper right corner, the user might have encountered an issue that significantly affected the user experience. Click the exclamation mark to enter this user’s Call diagnosis (Beta) page.
End-to-end details page
This page provides the following information for the selected sender-receiver pair:
-
Call Diagnosis conclusions. If the selected receiver and sender do not encounter significant experience issues, this information is hidden.
-
Quality metrics, including network status, device status, and audio and video quality. See User-specific metrics.
-
Key events, including a timeline view and a list view. In the list view, you can filter event types using the drop-down menu in the upper left corner.
Sender details page
This page contains the following information for the selected sender:
-
Call Diagnosis conclusions. If the selected sender does not encounter significant experience issues, this information is hidden.
-
Quality metrics, including network status, device status, and audio and video quality. See User-specific metrics.
-
Key events, including a timeline view and a list view. You can filter event types using the drop-down menu in the upper right corner.
View Call Diagnosis (Beta)
The Call Diagnosis page embeds Agora's auto-diagnosis engine to examine user experience issues and detect exceptions. The engine gives diagnosis conclusions based on a mapping between experience issues and possible causes. Currently, the engine is able to detect a number of call experience issues and host-specific issues. For details, see Diagnosis checklist items.
To view the Call Diagnosis page, follow these steps:
- Use Call Search to find the call you want to inspect, then click Call Details in the Action column.
- Click the Call Diagnosis (Beta) tab at the top of the page.
- Add the following filters, as needed:
- User: Enter the user ID to add users one by one, or use advanced search to add users in a batch. You can add up to 10 users for each diagnosis.
- Time: Drag the slider, or select from the drop-down menu.
- Exception: Select the exception type from the drop-down menu, such as sending issue, receiving issue, network issue, capturing issue, abnormal behavior, or user experience exception issue.
- Click a user in the returned list to see the diagnosis conclusion:
- If only one user ID is displayed, the conclusion is for the corresponding user.
- If two user IDs are displayed, the conclusion is for the corresponding sender-receiver pair.
- (Optional) Click View Details:
- If the conclusion is for a single user and the user is a sender, you enter the sender details page.
- If the conclusion is for a single user and the user is a receiver, you enter the call details homepage , and the switch for View metrics is turned on for the user.
- If the conclusion is for a sender-receiver pair, you enter their end-to-end details page.
Give your feedback
All features related to the auto-diagnosis engine are currently in beta. Follow these steps to send your feedback:
- Hover your mouse over a diagnosis entry in any of the following places:
- The Call Diagnosis page.
- The Call experience (beta), Host diagnosis (beta), or Abnormal host (beta) subsection on the Call Overview page.
- Hover your mouse over the highlighted text Is it accurate?.
- Click Accurate diagnosis or Inaccurate diagnosis.
- (Optional) Enter a detailed description in the text box.
- Click Submit.
See also
- For a detailed explanation of the metrics and diagnosis checklist items used by Call Inspector, see Call Inspector Glossary.
- Alternatively, you can use the Call Inspector service through the RESTful API. For details, see Agora Analytics RESTful API.